-
@booboo said in Climate Change #3 & Other Environmental Issues:
Although @Snowy suggest it's for the NH.
The original 1999 was.
"The original northern hemisphere hockey stick graph of Mann, Bradley & Hughes 1999"
They overlaid it later on with global data which showed a similar trend.
I know some will continue to argue the point, and even Wikipedia as a source as below, but it does give some background as to the debate.
"More than two dozen reconstructions, using various statistical methods and combinations of proxy records, support the broad consensus shown in the original 1998 hockey-stick graph, with variations in how flat the pre-20th century "shaft" appears.[12][13] The 2007 IPCC Fourth Assessment Report cited 14 reconstructions, 10 of which covered 1,000 years or longer, to support its strengthened conclusion that it was likely that Northern Hemisphere temperatures during the 20th century were the highest in at least the past 1,300 years.[14] Further reconstructions, including Mann et al. 2008 and PAGES 2k Consortium 2013, have supported these general conclusions."
It is an interesting debate regardless, especially if you doubt the veracity of data and news sources. It makes it very difficult to make your own mind up because it is all conspiracy in spite of evidence to the contrary like temperatures in Aus and California. Some skepticism is probably wise, but I believe that there are bush fires in Aus and that temperatures are record highs. Draw your own conclusions.
-
@booboo said in Climate Change #3 & Other Environmental Issues:
@Baron-Silas-Greenback said in Climate Change #3 & Other Environmental Issues:
They are both graphs covering roughly the same period and relative to similar time periods
Yeah I got that bit.
But what are they measuring on the y-axes?
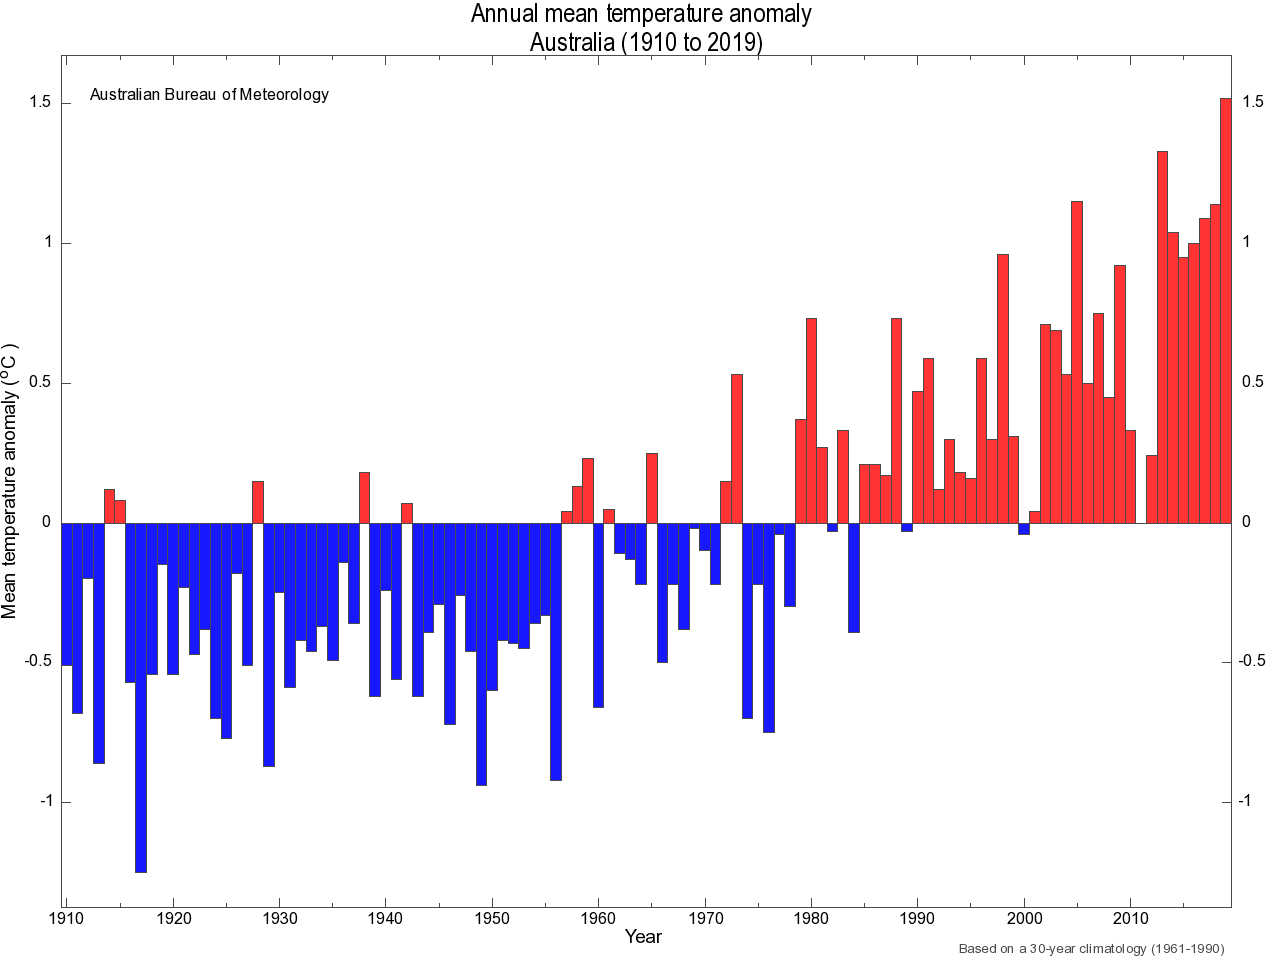
One appears to be some sort of difference from an average for a 30 year period of 1960-1990, with the implication that it is a global measurement. (Although @Snowy suggest it's for the NH.)
The other seems to be limited to Europe only, being a variance from some sort of average for the entire 20th century.
The data seems to be displayed differently.
From my potentially naive perspective they seem to be different measurements.
If they are the same perhaps I need assistance to understand how they are.
I get what you're saying and anyone who understands the visual representation of data knows the picture in question is useless. While you can compare different data sets, you need to use at least one common axis (normally the x axis). Comparing two different data sets with different x and y axes is pointless.
-
@antipodean said in Climate Change #3 & Other Environmental Issues:
While you can compare different data sets
Yes, if the data is taken from the same region of samples. Comparing data from a smaller sample (Europe) against Northern hemisphere or global only tells you that things in Europe were different to the rest of the planet and isn't an indication of the global picture being incorrect, which is is what is being postulated with the medieval warming being ignored.
@booboo As for the axes they are both around 1000 years on the x, but you got that. The title of the first is misleading as they are pointing to the 30 year period from 1960-1990 as the spike to highlight it I guess.
The y axis actually does make sense as a comparison if the data and geography were comparable, which they aren't. The top graph is using 0 deg temp change as a reference point and variance from there. The lower one uses 20th century average "European" temp as a reference (9.25 deg, call that 0 and it would work).
Having said that the scales look different anyway with 1 deg being much larger on the bottom one, so all of it is nonsense really. -
@antipodean said in Climate Change #3 & Other Environmental Issues:
@booboo said in Climate Change #3 & Other Environmental Issues:
@Baron-Silas-Greenback said in Climate Change #3 & Other Environmental Issues:
They are both graphs covering roughly the same period and relative to similar time periods
Yeah I got that bit.
But what are they measuring on the y-axes?
One appears to be some sort of difference from an average for a 30 year period of 1960-1990, with the implication that it is a global measurement. (Although @Snowy suggest it's for the NH.)
The other seems to be limited to Europe only, being a variance from some sort of average for the entire 20th century.
The data seems to be displayed differently.
From my potentially naive perspective they seem to be different measurements.
If they are the same perhaps I need assistance to understand how they are.
I get what you're saying and anyone who understands the visual representation of data knows the picture in question is useless. While you can compare different data sets, you need to use at least one common axis (normally the x axis). Comparing two different data sets with different x and y axes is pointless.
Cool.. except they havent done what you have claimed.
-
@Snowy said in Climate Change #3 & Other Environmental Issues:
@antipodean said in Climate Change #3 & Other Environmental Issues:
While you can compare different data sets
Yes, if the data is taken from the same region of samples. Comparing data from a smaller sample (Europe) against Northern hemisphere or global only tells you that things in Europe were different to the rest of the planet and isn't an indication of the global picture being incorrect, which is is what is being postulated with the medieval warming being ignored.
The benefit of comparing them both properly is it can show that just because in one region the effect is A, that doesn't discount the across the world, climate is doing B.
The y axis actually does make sense as a comparison if the data and geography were comparable, which they aren't. The top graph is using 0 deg temp change as a reference point and variance from there. The lower one uses 20th century average "European" temp as a reference (9.25 deg, call that 0 and it would work).
Having said that the scales look different anyway with 1 deg being much larger on the bottom one, so all of it is nonsense really.Both scales given the data would be trivially easy to standardise. Given the first is relative to a time period, then the second should be the same.
-
@antipodean said in Climate Change #3 & Other Environmental Issues:
The benefit of comparing them both properly is it can show that just because in one region the effect is A, that doesn't discount the across the world, climate is doing B.
Exactly what I was getting at. The comparison shows the difference but not a universal change. It doesn't make either incorrect.
@antipodean said in Climate Change #3 & Other Environmental Issues:
Both scales given the data would be trivially easy to standardise. Given the first is relative to a time period, then the second should be the same.
Yes it would, but they haven't.
-
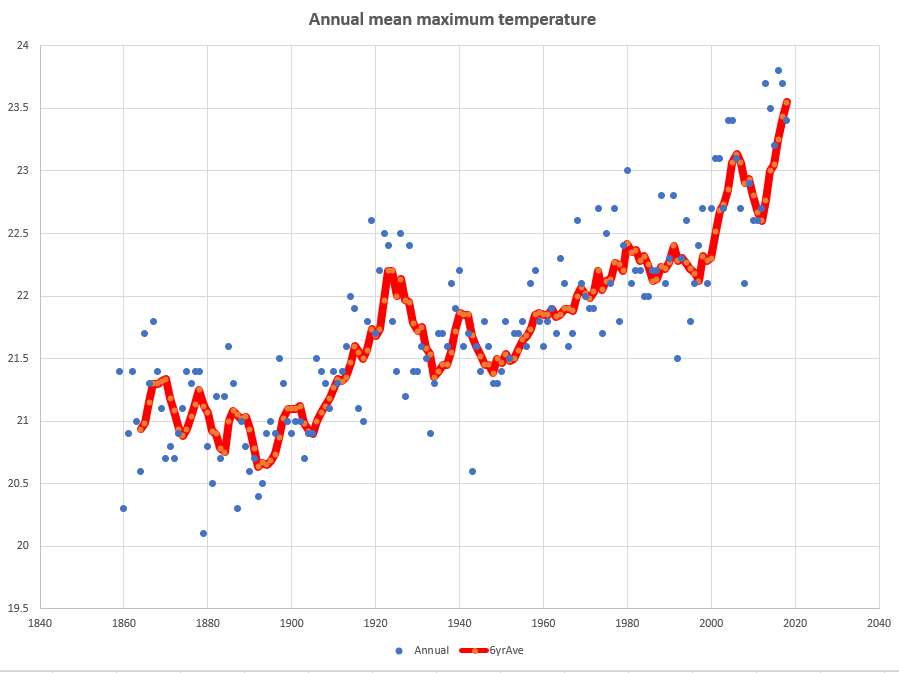
I don't have access to temperature records from thousands of years ago so I did a simple graph showing Sydney's annual mean max temperature since records began. Records say the mean annual max temp has gone from 21 to 23.5. Not really a hockey stick but more an uphill climb?
Data link.
-
@Snowy said in Climate Change #3 & Other Environmental Issues:
@booboo said in Climate Change #3 & Other Environmental Issues:
Although @Snowy suggest it's for the NH.
The original 1999 was.
"The original northern hemisphere hockey stick graph of Mann, Bradley & Hughes 1999"
They overlaid it later on with global data which showed a similar trend.
I know some will continue to argue the point, and even Wikipedia as a source as below, but it does give some background as to the debate.
"More than two dozen reconstructions, using various statistical methods and combinations of proxy records, support the broad consensus shown in the original 1998 hockey-stick graph, with variations in how flat the pre-20th century "shaft" appears.[12][13] The 2007 IPCC Fourth Assessment Report cited 14 reconstructions, 10 of which covered 1,000 years or longer, to support its strengthened conclusion that it was likely that Northern Hemisphere temperatures during the 20th century were the highest in at least the past 1,300 years.[14] Further reconstructions, including Mann et al. 2008 and PAGES 2k Consortium 2013, have supported these general conclusions."
It is an interesting debate regardless, especially if you doubt the veracity of data and news sources. It makes it very difficult to make your own mind up because it is all conspiracy in spite of evidence to the contrary like temperatures in Aus and California. Some skepticism is probably wise, but I believe that there are bush fires in Aus and that temperatures are record highs. Draw your own conclusions.
Did these other reconstruction refuse to release their data and calculations?
-
@chimoaus said in Climate Change #3 & Other Environmental Issues:
I don't have access to temperature records from thousands of years ago so I did a simple graph showing Sydney's annual mean max temperature since records began. Records say the mean annual max temp has gone from 21 to 23.5. Not really a hockey stick but more an uphill climb?
Data link.
You need to be careful as to where the data comes from. In both NZ and Aust various data record include unexplained adjustments. And without them there is often almost no increase. The other issue is the changes over time where the records are taken. For example in an open field compared to beside a building
That's why I prefer the satellite records. It harder to manipulate these records. And it shows the last 40 years. Long enough to show if there has been significant warming as CO2 has increased. And quite a large increase too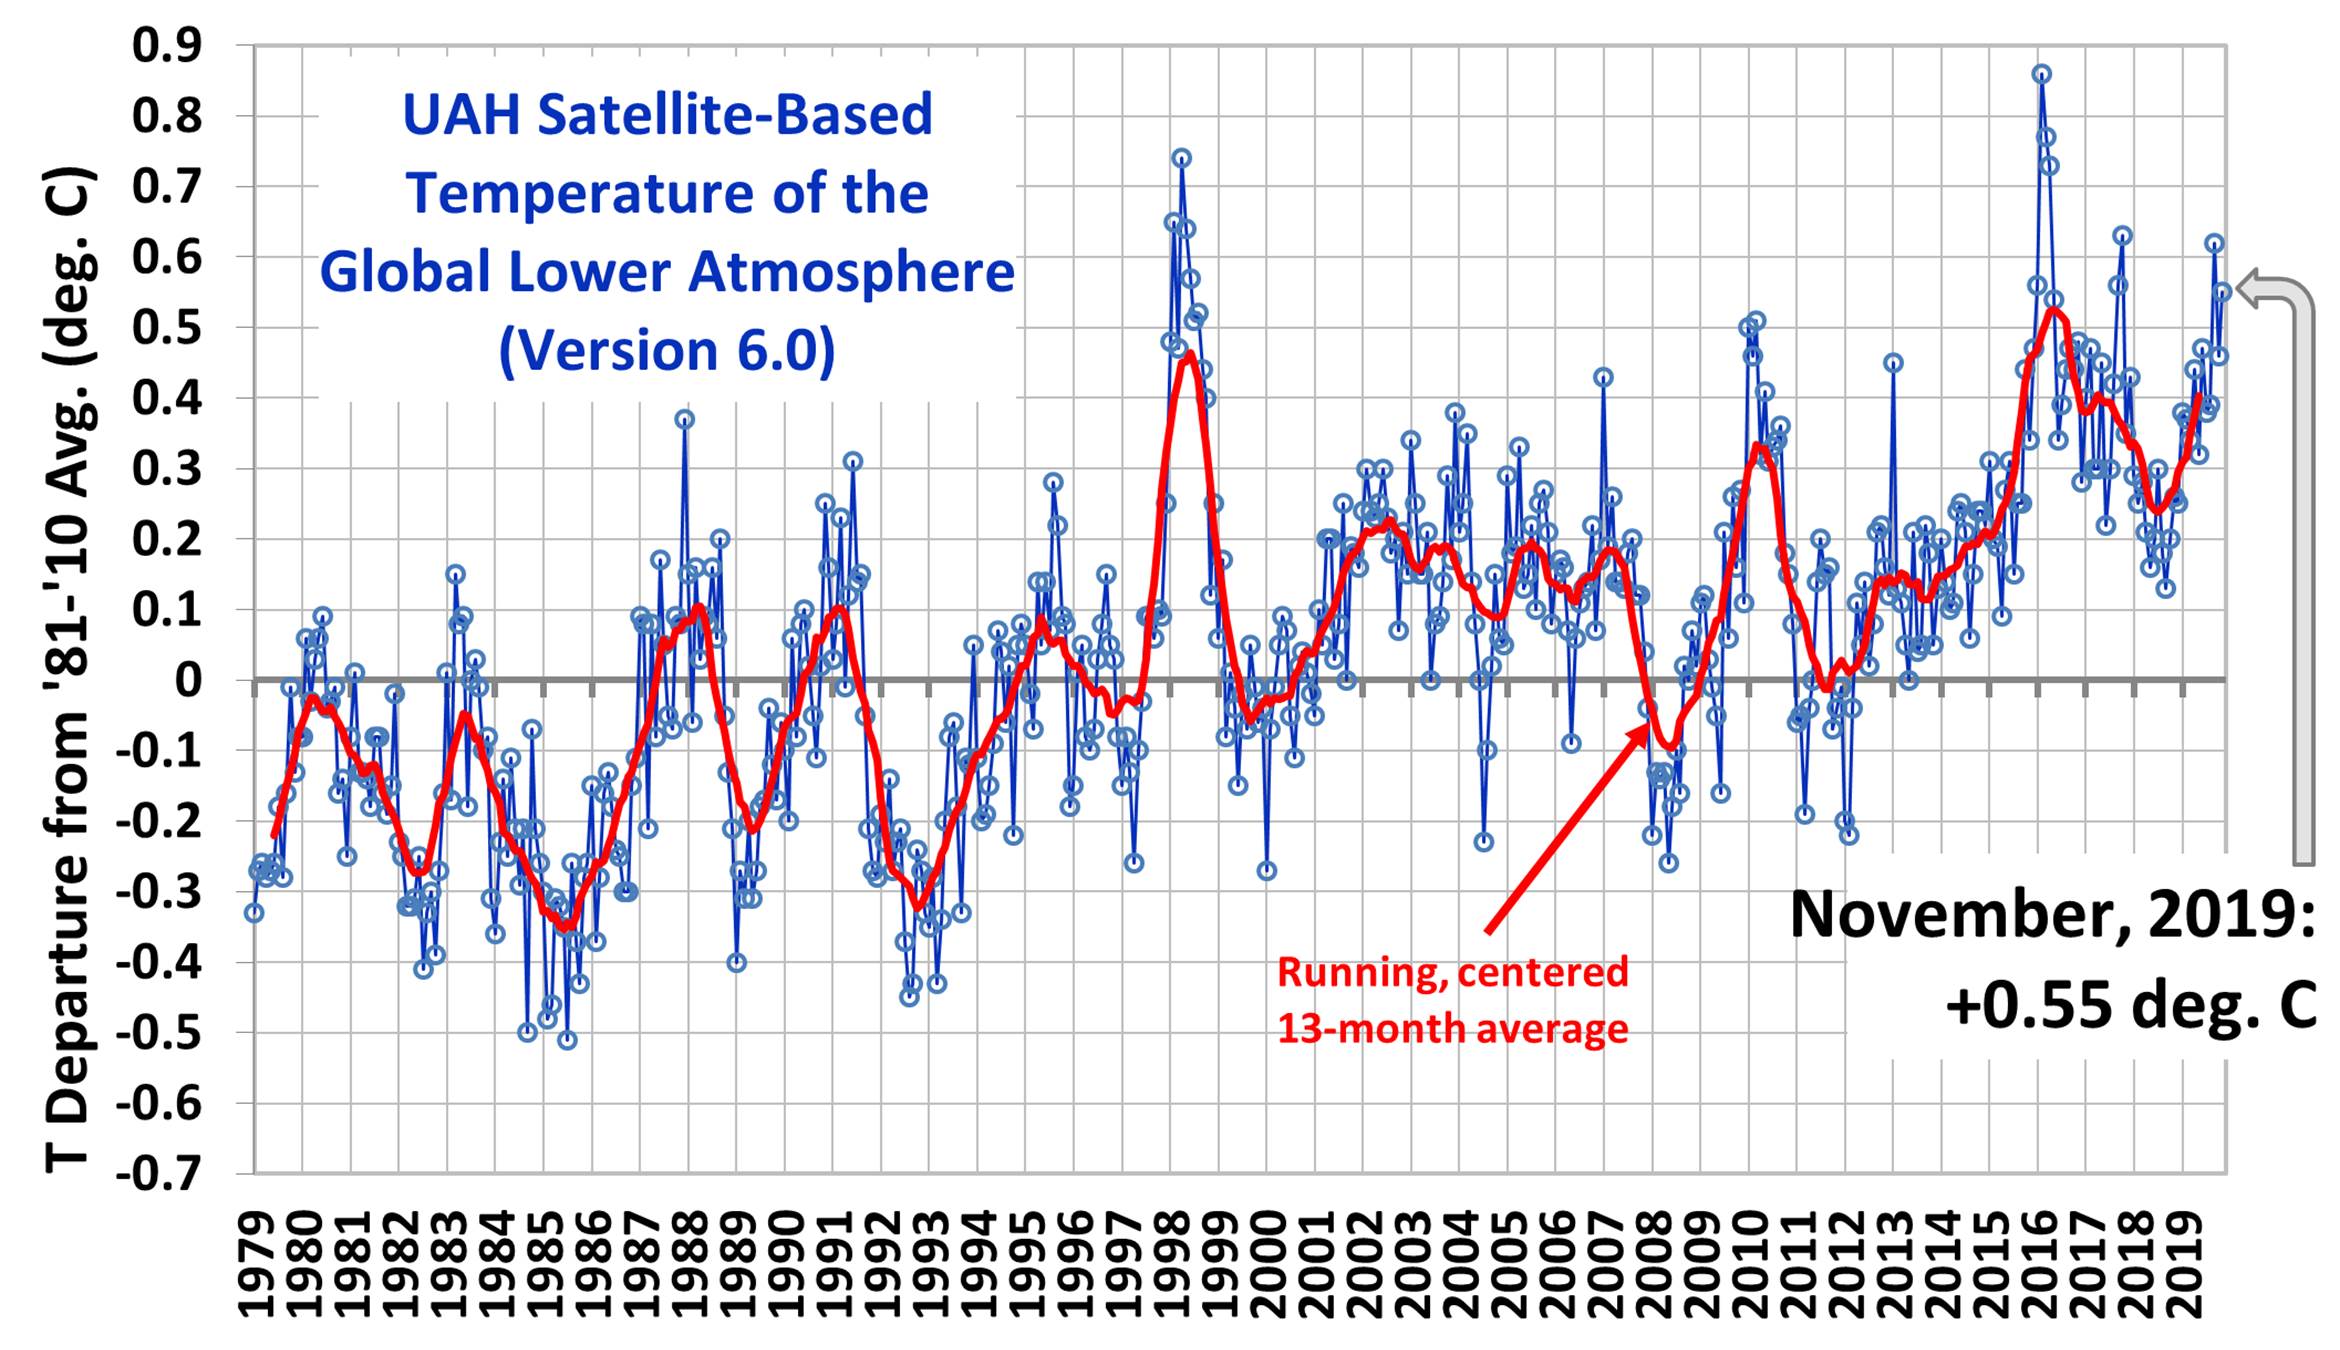
-
@Winger said in Climate Change #3 & Other Environmental Issues:
You need to be careful as to where the data comes from. In both NZ and Aust various data record include unexplained adjustments. And without them there is often almost no increase
How do you know what the adjustments are?
From the BOM: (http://www.bom.gov.au/climate/data/acorn-sat/#tabs=Methods)
Consistency and adjustment of temperature records
A large number of factors affect the consistency of the temperature records over time. For this reason, a dataset such as ACORN-SAT is required for climate research.While considerable effort is made to keep observational practices consistent—and to keep a careful log of changes at each site—each change in methodology or technology can leave its mark on the record.
These include artificial changes in the record due to:
- a shift in the location of the station (for example, from a post office to an airport);
- a change in the environment around the station (for example a tree grows, a structure is built, a lawn is irrigated); or
- a change in measurement method (for example, from a manual instrument to a recording electronic instrument).
Adjustments are required to correct for these non-climate-related influences—since they may create artificial ‘jumps’ in the data over time. Correcting these biases is a key requirement for compiling and then analysing long-term records of daily maximum and minimum temperatures.
The Bureau does not alter the original temperature data measured at individual stations. Rather, the Bureau creates additional long, continuous and consistent (homogeneous) records for locations across the country.
This is accomplished by concatenating copies of individual station records and then making appropriate adjustments for artificial (non-climate related) discontinuities. Almost all locations require the concatenation of multiple observing sites—to extend temperature records back to 1910. These new dataseries are a complement to, not a replacement of, the original data.
-
Heres the NZ case
 New Zealand's NIWA sued over climate data adjustments

NIWA is being sued by the NZ Climate Coalition, mainly due to the differences in data in this graph: Niwa sued over data accuracy The country’s state-owned weather and atmospheric…

-
@Winger said in Climate Change #3 & Other Environmental Issues:
Did these other reconstruction refuse to release their data and calculations?
Probably not, nor do I care. It will be intellectual property and he has no reason to release it. That doesn't make it untrue. Somebody paid for that as you keep saying, so they own it.
The motivations for keeping it on the quiet aren't up to us to decide but people way more in the know than you and I accepted it.
-
@Winger said in Climate Change #3 & Other Environmental Issues:
Heres the NZ case
New Zealand's NIWA sued over climate data adjustments
NIWA is being sued by the NZ Climate Coalition, mainly due to the differences in data in this graph: Niwa sued over data accuracy The country’s state-owned weather and atmospheric…
The case they lost?
-
@antipodean said in Climate Change #3 & Other Environmental Issues:
The case they lost?
Yep.
http://www.stuff.co.nz/national/7634556/Climate-sceptics-fail-in-Niwa-case
Justice Venning:
**"said NIWA acted "within its own sphere of expertise".Justice Venning said unless the trust could point to some defect in NIWA's decision-making process or show that the decision was clearly wrong in principle or in law the court could not intervene."**
-
@Snowy said in Climate Change #3 & Other Environmental Issues:
@antipodean said in Climate Change #3 & Other Environmental Issues:
The case they lost?
Yep.
http://www.stuff.co.nz/national/7634556/Climate-sceptics-fail-in-Niwa-case
Justice Venning:
**"said NIWA acted "within its own sphere of expertise".Justice Venning said unless the trust could point to some defect in NIWA's decision-making process or show that the decision was clearly wrong in principle or in law the court could not intervene."**
I believe the world is warming, NZ included, but that still seems highly dodgy. Without knowing specifics I'm also not sure I could take a court as having the expertise to make a fair ruling on that case, can't be that hard to explain away something very technical to people who may not have the level of expertise to understand.
From what I've read 6 stations weren't changed, I haven't been able to work out how to find the raw figures for the 6 unchanged stations only, would be keen to have a look at that if anyone can point me in the right direction. Maybe it vindicates the NIWA folk anyway.
-
@Rembrandt said in Climate Change #3 & Other Environmental Issues:
not sure I could take a court as having the expertise to make a fair ruling on that case
Hey welcome to the world. Innocent people get locked up all the time too. If you a have a better idea for a judicial system, go for it. The point is the skeptics lost as they didn't have a valid case to question NIWA.
We all have doubts about some of the science, some of the forecasts, even some of the outcomes as regards to our own circumstance, but denying that it is happening....well...
-
@Snowy said in Climate Change #3 & Other Environmental Issues:
@Rembrandt said in Climate Change #3 & Other Environmental Issues:
not sure I could take a court as having the expertise to make a fair ruling on that case
Hey welcome to the world. Innocent people get locked up all the time too. If you a have a better idea for a judicial system, go for it. The point is the skeptics lost as they didn't have a valid case to question NIWA.
We all have doubts about some of the science, some of the forecasts, even some of the outcomes as regards to our own circumstance, but denying that it is happening....well...
CC really is a money making end of world religion now. Take out the huge money and it would all disappear pronto.
This religion is based on dodgy 'science' where the people concerned who provide the so called science refuse to release their data and calculations. Or provide an explanation where historical data is adjusted. The group who challenged the adjustments only wanted an explanation. That they never got
So I will stick with the unadjusted records. That shows warming but not much
-
@Winger said in Climate Change #3 & Other Environmental Issues:
This religion is based on dodgy 'science' where the people concerned who provide the so called science refuse to release their data and calculations. Or provide an explanation where historical data is adjusted. The group who challenged the adjustments only wanted an explanation.
Actually your own source says the statement of claim is vastly different, quelle surprise:
The statement of claim filed on behalf of the New Zealand Climate Science Education Trust (NZCSET) asks the court for three rulings:
A: to set aside NIWA’s decisions to rely upon its Seven Station Series (7SS) and Eleven Station Series (11SS), and to find the current NZTR to be invalid
B: to prevent NIWA from using the current NZTR (or information originally derived from it) for the purpose of advice to any governmental authority or to the public
 to require NIWA to produce a full and accurate NZTR.
New Zealand's NIWA sued over climate data adjustments
to require NIWA to produce a full and accurate NZTR.
New Zealand's NIWA sued over climate data adjustments
NIWA is being sued by the NZ Climate Coalition, mainly due to the differences in data in this graph: Niwa sued over data accuracy The country’s state-owned weather and atmospheric…
Climate Change
 Hockey stick graph - Wikipedia